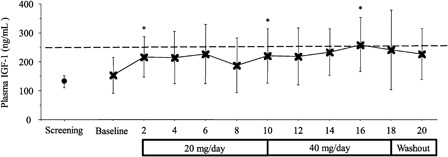
Figure 1.

Plasma IGF-1 concentration across bi-weekly treatment observations. Time point data are reported as group mean (±SD). The mean change in plasma IGF-1 concentration from baseline to week 2 (*P < 0.05), weeks 8 to 10 (*P < 0.05), and weeks 8 to 16 (*P < 0.05) was significant.
