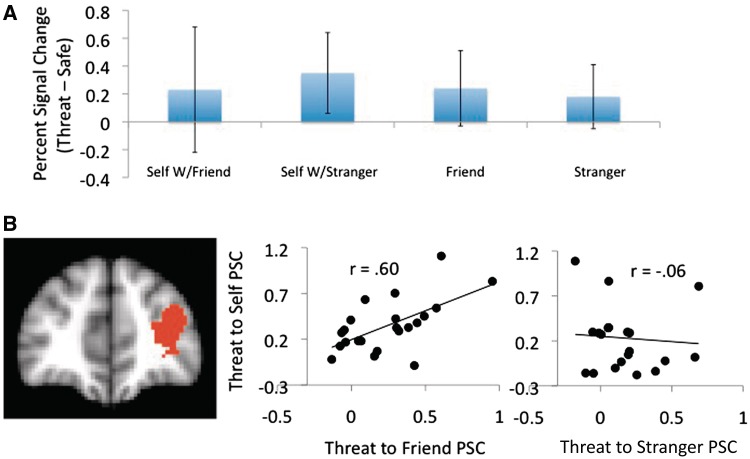
Fig. 2.
(A) Bar graphs showing group level means and standard deviations of PSC by condition in the left LPFC (−34.4, 16.3, −2.46). (B) Scatter plots showing the correlation between threat-to-self and threat-to-other PSC in the same region. Note the lack of apparent differences in the group means (A), despite dramatic differences in the correlations between self-threat PSC and other-threat PSC as a function of familiarity (B).

