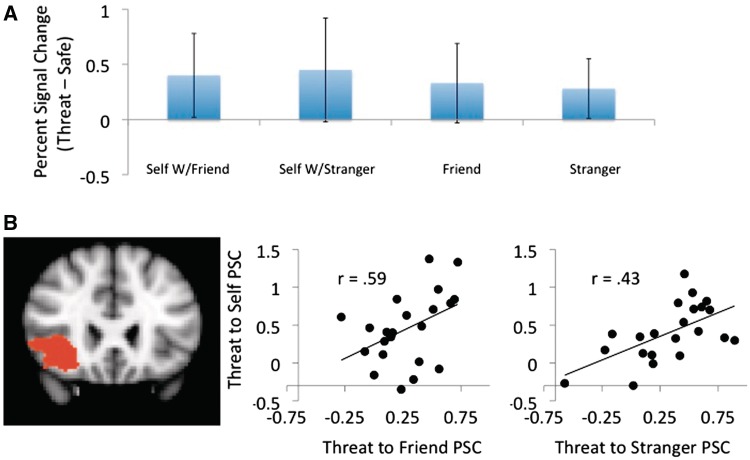
Fig. 3.
(A) Bar graphs showing group level means and standard deviations of PSC by condition in the right OFC (37.4, 24.9, −5.6). (B) Scatter plots showing the correlation between threat-to-self and threat-to-other PSC in the same region. Note that here both the group means and individual differences suggest substantial similarity in how the right OFC is processing self-, friend- and stranger-directed threats.

