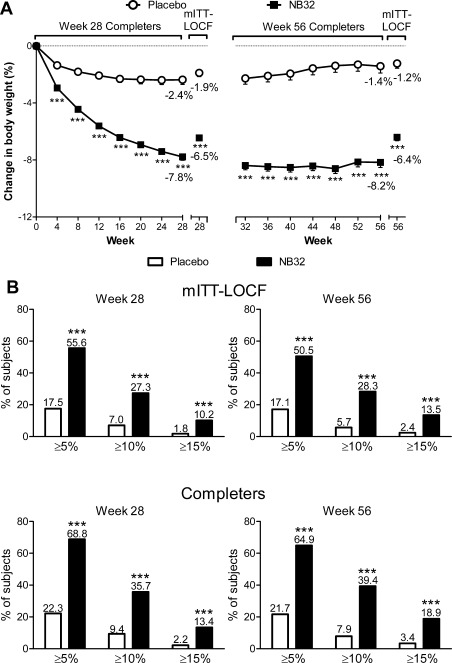
FIGURE 3.

A) Percent weight loss (observed; LS mean ± SE) by visit in the week 28 and 56 completers populations (NB32 data are weighted for weeks 32-56), and percent weight loss for the week 28 and 56 mITT-LOCF populations. ***P < 0.001 for NB32 vs. Placebo. B) Categorical weight loss in week 28 and 56 mITT-LOCF and Completers populations. ***P < 0.001 for NB32 vs. Placebo. In both panels, week 56 data for NB32 are weighted as described in the Statistical analyses section.
