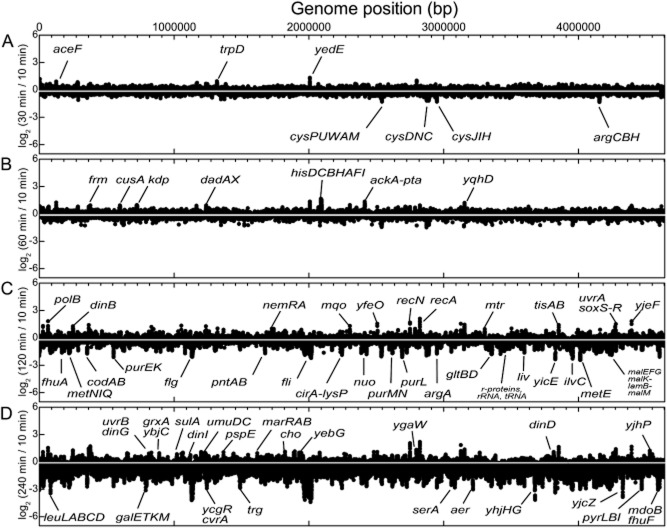
Fig. 8.
Genome-wide RNAP occupancy changes in MG1655 upon progressive MG accumulation in Type III experiments. ChIP-chip signals for test DNA (cAMP-treated) at t30min (A), t60min (B), t120min (C) and t240min (D) was compared in silico to test signals at t10min, thus visually eliminating cAMP-induced changes and highlighting MG induced changes in RNAP occupancy. For each time point Cy5 signal intensities were averaged from two independent replicates and log2 ratios were calculated. Log2 ratios were then normalized with respect to eight reference regions across the genome that exhibited low signal intensities in both cAMP-treated and untreated cells and that did not change over time (see Supporting information). For a complete list of significant changes see Table S3.

