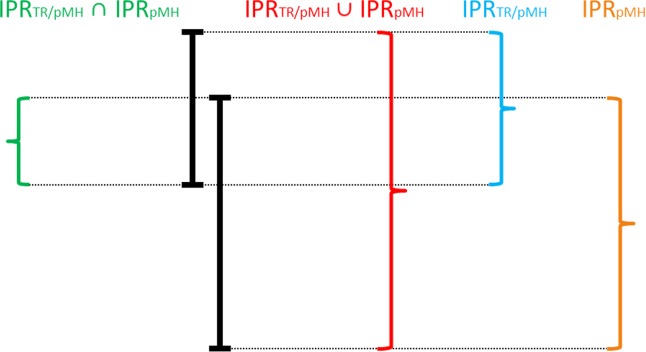
Figure 2.

Percentages of overlap : Percentages of overlap
 [eq. (7)] is obtained by the subset
 (green) relative to the union of the set
 (red). Percentages of overlap
 [eq. (8)] is obtained by the subset
 (green) relative to the subset
 (blue). Percentages of overlap
 [eq. (9)] is obtained by the subset
 (green) relative to the subset
 (orange). [Color figure can be viewed in the online issue, which is available at http://wileyonlinelibrary.com.]
