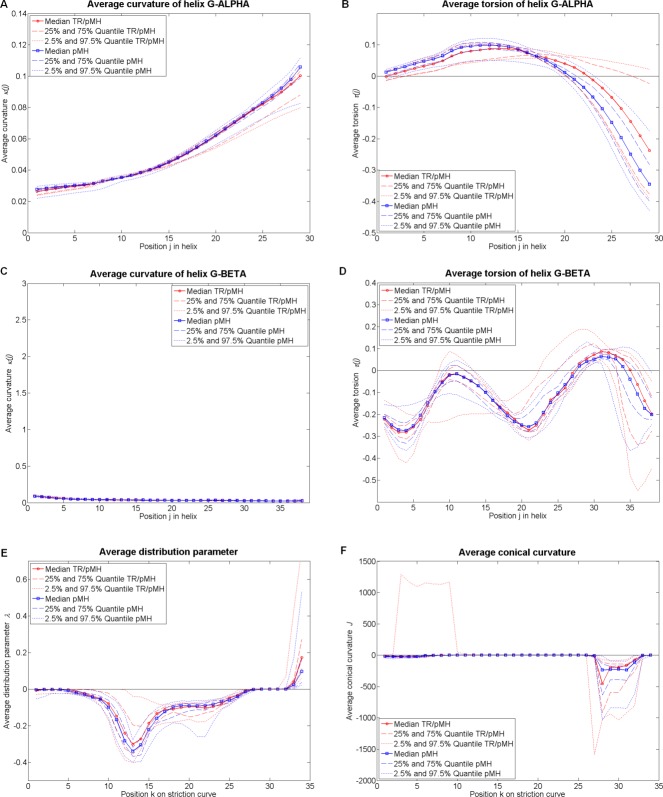
Figure 4.
Results for Test set 1: How TRs deform MH α-helices, MH2 case. We compared 18 pMH2 complexes (blue) against 10 TR/pMH2 complexes (red). The medians are depicted as solid lines the interquartile ranges are depicted as dashed lines and the IPR are depicted as dotted lines. (A, B) Average curvature (nm−1) and average torsion
 (nm−1) of the helix G-ALPHA at 29 (j) positions obtained as moving average of the local parameters over a turn (see Methods). (C, D) Average curvature
 (nm−1) and average torsion
 (nm−1) of the helix G-BETA at 38 (j), obtained as moving average of the local parameters over a turn (see Methods). (E, F) Average distribution parameter
 (nm) and average conical curvature
 (–) of the ruled surface at 34 (k) positions on the striction curve
 , obtained as moving average of the local parameters over an average turn (see Methods). The zoomed figures of the average conical curvature
 are depicted in Supporting Information Figure S5 and the arc tangent representation in Supporting Information Figure S6B. [Color figure can be viewed in the online issue, which is available at http://wileyonlinelibrary.com.]

