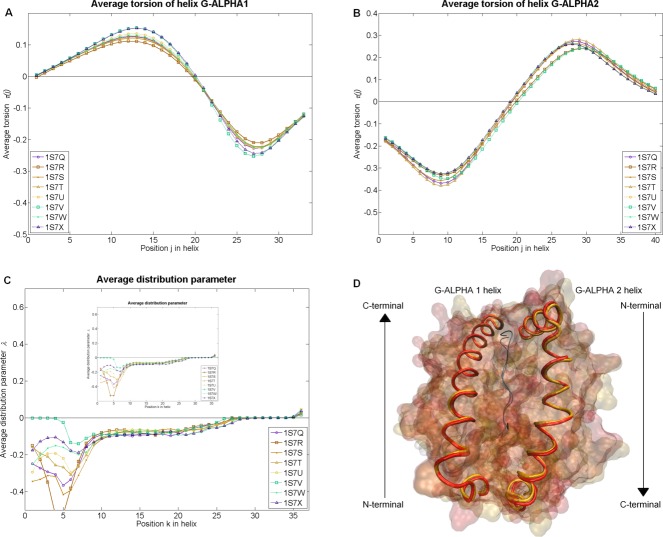
Figure 5.
Results of Test set 2: MH1 cross evaluation. We compared eight pMH1 complexes (H-2Kb and H-2Db presenting four different peptides each). (A) Average torsion (nm−1) of the helix G-ALPHA1 at 34 (j) positions obtained as moving average of the local parameters over a turn. (B) Average torsion
 (nm−1) of the helix G-ALPHA2 at 40 (j) positions obtained as moving average of the local parameters over a turn. (C) Average distribution parameter
 (nm) of the ruled surface at 36 (k) positions on the striction curve
 obtained as moving average of the local parameters over an average turn. (D) Graphical visualization of the H-2Kb (orange with the PDB accession code 1s7r) and the H-2Db (red with the PDB accession code 1s7v) in complex with the peptide KAVYNLATM. All parameters of this example are illustrated in Figure S11 of the Supporting Information. In Supporting Information Table S3, we presented the resolutions and b-factors of these complexes.

