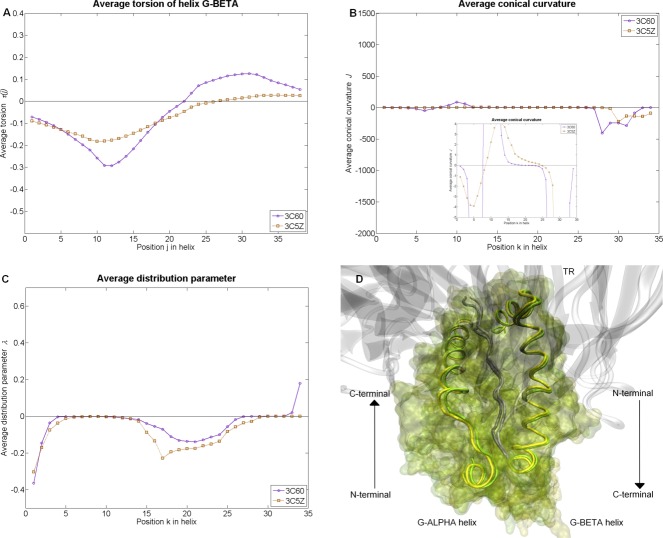
Figure 6.
Results of Test set 3: Different TRs. We compared two TR/pMH2 complexes (I-Ab presenting the peptide FEAQKAKANKAVD in complex with the TR YAe62 and in complex with the TR B3K506). (A) Average torsion (nm−1) of the helix G-BETA at 38 (j) positions originating by calculating the moving average of the local parameters over a turn. (B, C) Average distribution parameter
 (nm) and average conical curvature
 (–) of the ruled surface at 34 (k) positions on the striction curve
 , originated by calculating the moving average of the local parameters over an average turn. (D) Graphical visualization of the I-Ab in complex with YAe62 (yellow with the PDB accession code 3c60) and the I-Ab in complex with B3K506 (green with the PDB accession code 3c5z). All parameters of this test set are illustrated in Figure S12 of the Supporting Information. In Supporting Information Table S3, we presented the resolutions and b-factors of these complexes. [Color figure can be viewed in the online issue, which is available at http://wileyonlinelibrary.com.]

