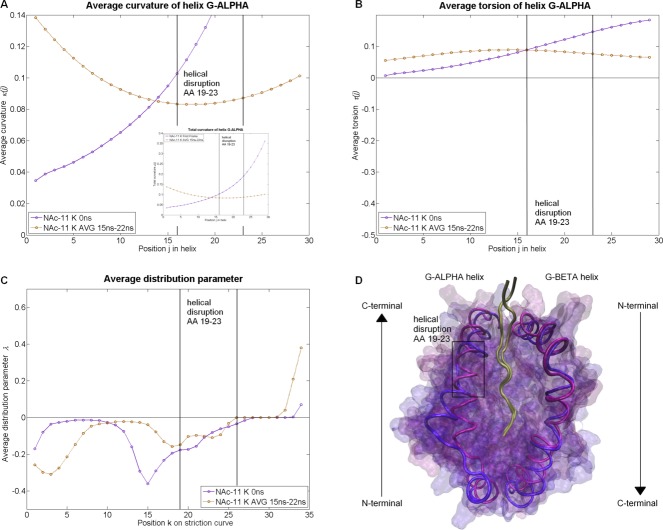
Figure 7.
Results of Test set 4: Helical disruption during a Molecular Dynamics simulation. We compared two snapshots of the I-Au/MBP1-11 complex simulation (at time 0 ns and an average of the time between the 15th and the 22nd ns). (A, B) Average curvature (nm−1) and average torsion
 (nm−1) of the helix G-ALPHA at 29 (j) positions originated by calculating the moving average of the local parameters over a turn. (C) Average distribution parameter
 (nm) of the ruled surface at 34 (k) positions on the striction curve
 , originated by calculating the moving average of the local parameters over an average turn. (D) Graphical visualization of the snapshot at 0 ns (violet) and the average snapshot (blue). All parameters of this test set are illustrated in Figure S13 of the Supporting Information. In Supporting Information Table S3, we presented the resolutions and b-factors of these complexes.

