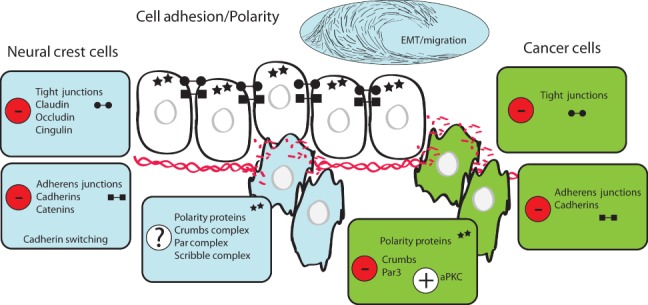
FIGURE 2.

Comparison of cell adhesion and polarity changes in neural crest (NC) cells and cancer cells. The diagram depicts alterations in tight junction components (circle barbells), adherens junction components (square barbells), and polarity proteins (stars) during epithelial-to-mesenchymal transition (EMT) and migration in NC cells (light blue) and cancer cells (green) as they differentiate and migrate away from normal epithelial cells (white). Passage of cells through the basement membrane and disruption of the extracellular matrix (ECM; red intertwined lines and red broken fragments) is indicated.
