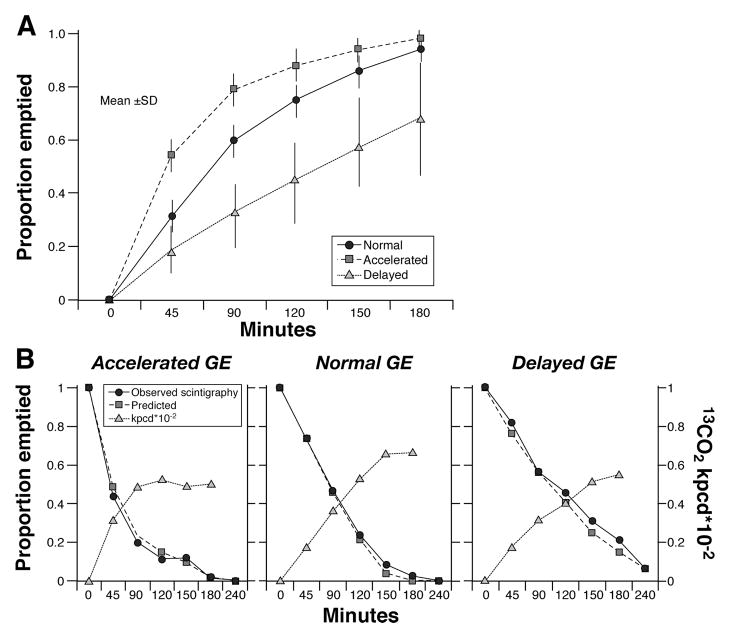
Figure 1.
A. Summary of gastric emptying results by t1/2 group in 129 subjects with clinically suspected delayed gastric emptying. Data show mean ± SD. B. This figure illustrates 13CO2 enrichment of breath excreted over 3 hours (right Y-axis κPCD × 10−2), as well as the observed proportion emptied by the stomach by scintigraphy (left Y-axis) and the predicted gastric emptying based on the mathematical formulae and the 13CO2 excretion measured.

