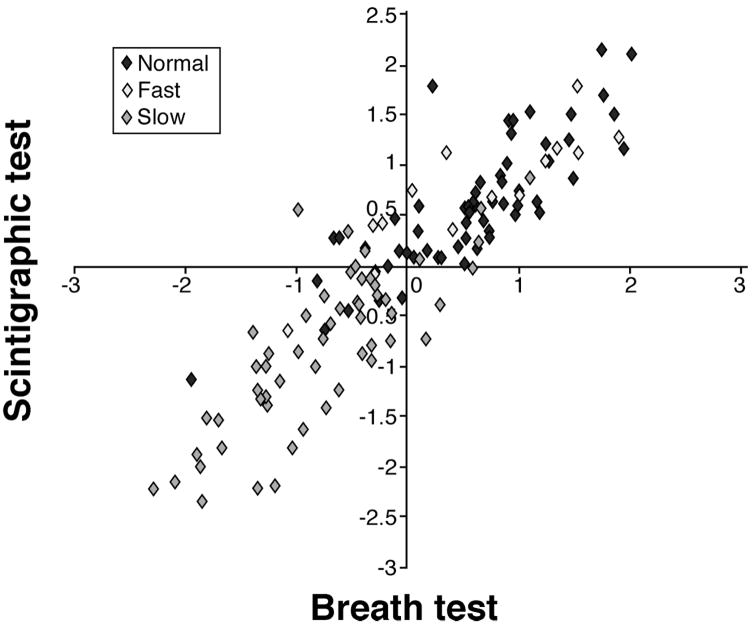
Figure 2.
Plot of the first canonical variates (linear combinations with maximal correlation) with scintigraphic variate on the Y-axis and the [13C]-Spirulina platensis GEBT breath kPCD variate on the X-axis. Specifically, the first canonical variate for the GE proportions (Y-axis in figure) has a strong (negative) relationship with the scintigraphically based t ½ values (Spearman correlation of −0.82, p<0.001). The first canonical variate of the kPCD values (X-axis in figure) was also strongly related to these t ½ values (Spearman correlation of −0.73, p<0.001). Since more delayed GE corresponds to larger t ½ values, the correlation of these canonical variates with t ½ values is negative, reflecting the propensity of the more delayed GE subjects in the lower left quadrant and the more accelerated GE subjects in the upper right quadrant.

