
Figure 3.
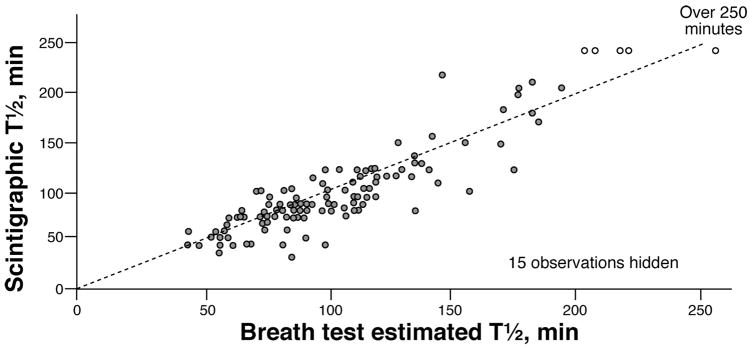
Scatterplot of the scintigraphic measured gastric emptying t ½ values (Y-axis) versus the breath test estimated t ½ values (X-axis) obtained from linear interpolation of breath test predicted GE proportions. The dotted line shows X=Y.
Official websites use .gov
A
.gov website belongs to an official
government organization in the United States.
Secure .gov websites use HTTPS
A lock (
) or https:// means you've safely
connected to the .gov website. Share sensitive
information only on official, secure websites.
Scatterplot of the scintigraphic measured gastric emptying t ½ values (Y-axis) versus the breath test estimated t ½ values (X-axis) obtained from linear interpolation of breath test predicted GE proportions. The dotted line shows X=Y.