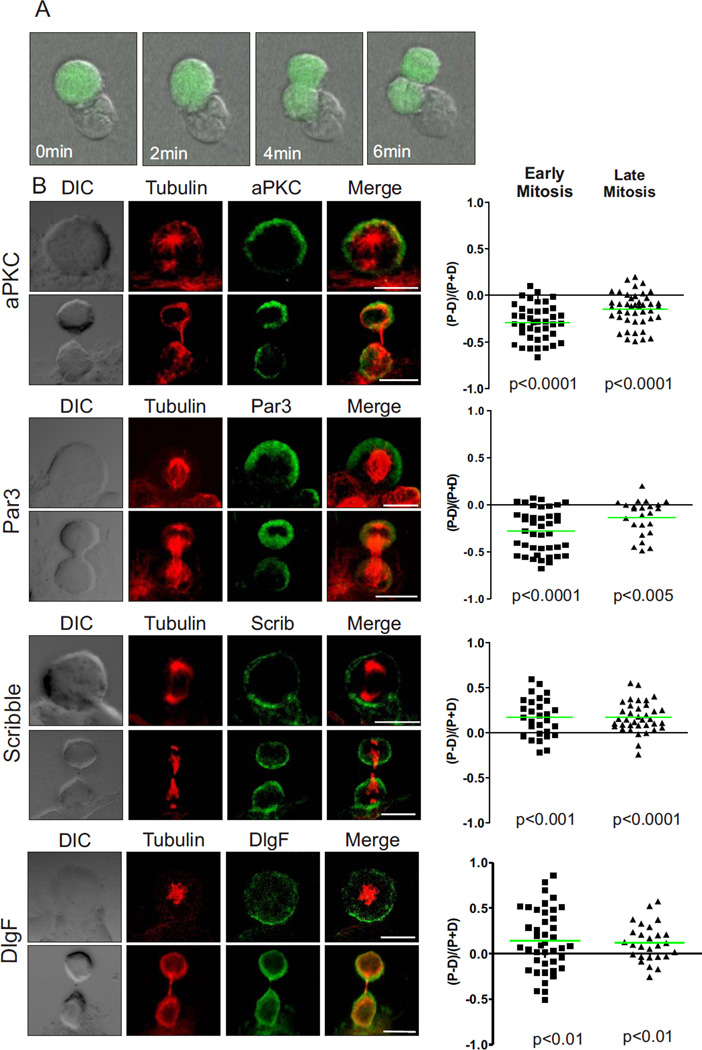
Figure 1.
Polarity proteins are asymmetric in mitotic T cells interacting with DC. (A) Naïve OT-1 CD8+ T cells expressing GFP were cultured with peptide-pulsed dendritic cells. The co-cultures were left for 40 hrs prior to imaging and then imaged by time-lapse microscopy every two minutes. Still images show an example of a T cell dividing while attached to a dendritic cell - time stamp shows time of progression through mitosis. Scale bar: 25 µm. (B) Naïve OT-1 CD8+ T cells dividing in response to antigen presentation by DC were fixed and stained to determine the ratio of proximal to distal polarization of aPKC, PAR-3, Scribble, and DlgF (3 experiments; 73, 61, 66 and 80 cells were analyzed respectively, representative images on the left). Positive and negative values indicate proximal and distal polarization respectively. Each point on the graph represents an individual cell and the green bar represents the mean. Scale bars: 10 µm.

