Figure 2.
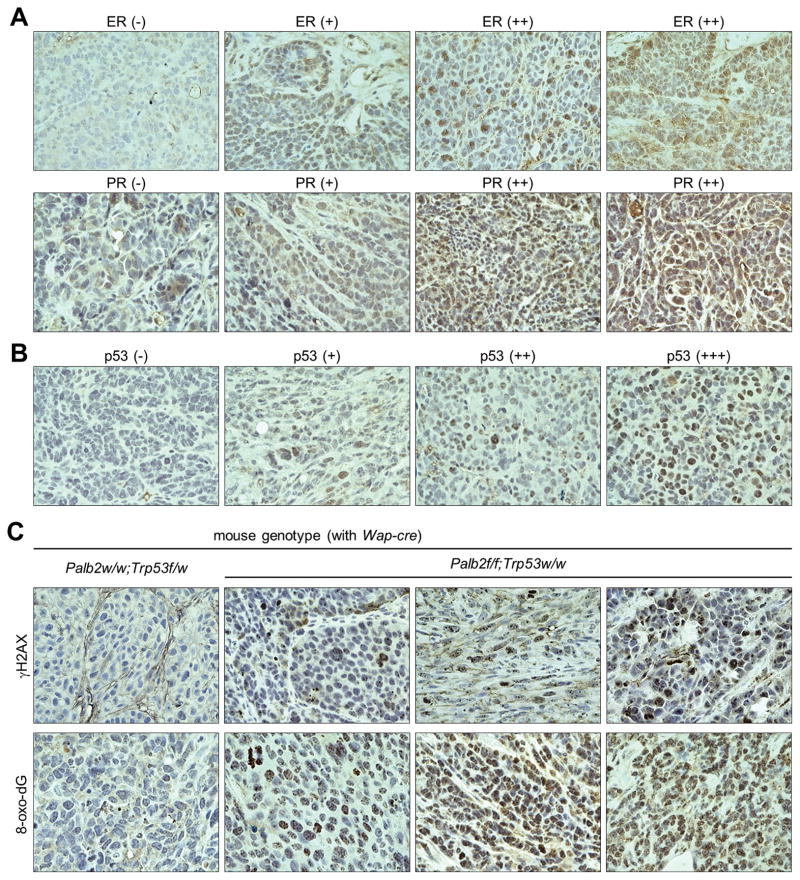
Characterization of Palb2-asscoiated mouse mammary tumors by IHC. A, Representative ER and PR staining patterns of the tumors. Since similar percentage of staining- positive cells were found in most of the positive tumors, assignment of “+” or “++” grades is purely based on the intensity of staining signals. B, Representative staining patterns of p53 in the tumors. Grade assignment is based on the relative staining intensity. C, Different staining patterns of γH2A.X. (upper panels) and 8-oxo-dG (lower panels) in the control and Palb2-null tumors.

