
Fig. 6.
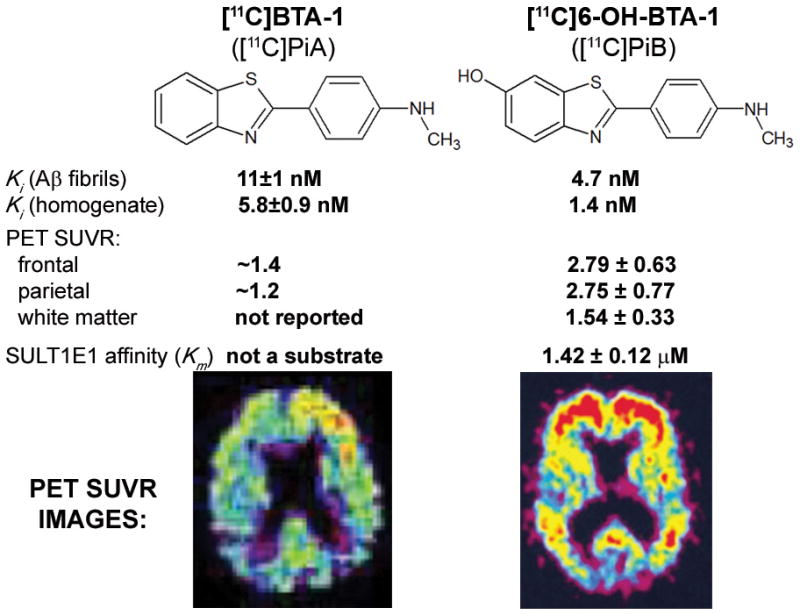
Molecular structures, binding constants, SUVRs, and affinities of the Aβ imaging probes [11C]PiA and [11C]PiB vs. SUVR PET image. SUVR values are referenced to cerebellar grey matter and are therefore independent the influence of variable peripheral metabolism. Standardized uptake value ratio (SUVR) images, normalized to cerebellum, of two Alzheimer’s disease patients independently injected with both imaging probes ([11C]PiB, [26]; [11C]PiA, [84]). No color scale is available in the case of BTA-1. SUVR values are based on values reported in text on page 277 in [84]. (This Figure contains parts of Figures from references [26] and [84]; with permission)