
Figure 6. LTP deficits in rTg4510 mice are rescued with YM-01 treatment.
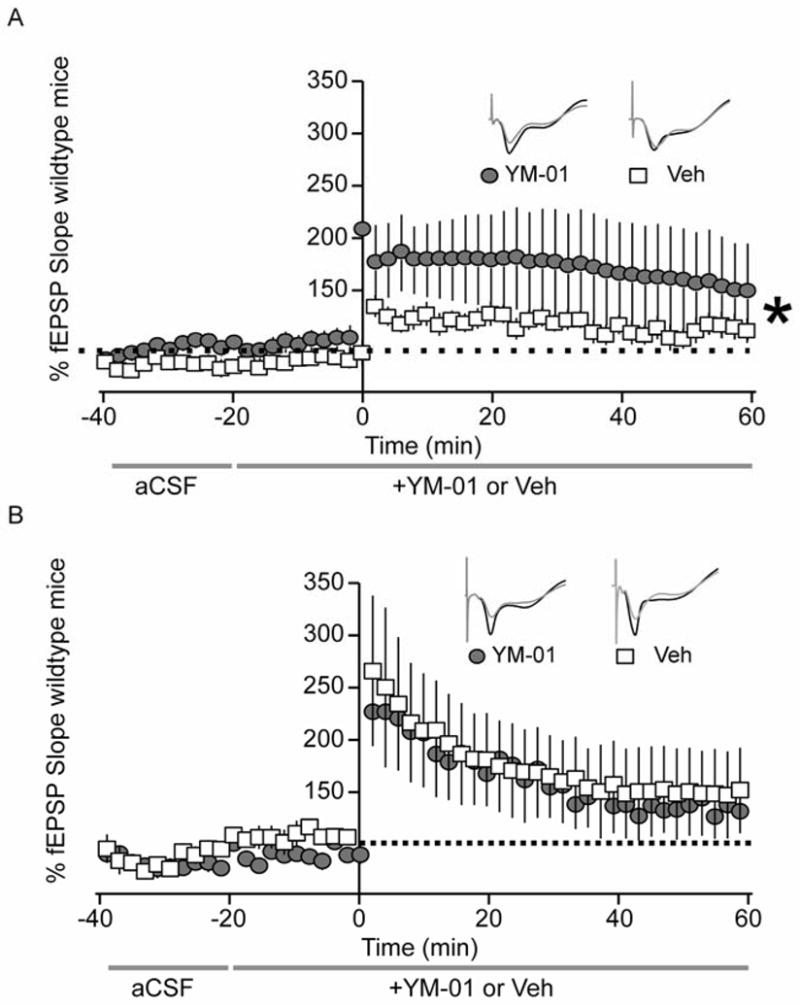
Graphical representation of electrophysiology experiments in hippocampal slices of 3.5 month old (A) rTg4510 and (B) non-transgenic wildtype mice. After recording baseline signal for 20 min, hippocampal slices were perfused with 30μm YM-01 or vehicle control in aCSF continuously for the remainder of the experiment. Baseline signal was recorded for 20 min, LTP was induced with TBS (5 bursts of 200 Hz separated by 200 ms, repeated 6 times with 10 s between the 6 trains), and LTP was recoded for 60 min. Changes in fEPSP slope are expressed as a percentage of baselines. (A) Gray circles and white boxes represent fEPSP traces of YM-01- (n=9) or vehicle-treated (n=16) hippocampal slices from 3.5 month old tau transgenic mice. (B) Gray circles and white boxes correspond to fEPSP traces of YM-01- (n=4) or vehicle-treated (n=7) hippocampal slices from 3.5 month old non-transgenic mice. Statistical analysis was performed using a 2-way ANOVA with Bonferroni post-test. Tau transgenic hippocampi treated with YM-01 displayed a significantly different LTP curve compared to vehicle-treated transgenic controls (***p=0.00097). LTP slopes for non-transgenic hippocampi were not significantly different (p=0.98). Gray traces represent baseline recordings, while black traces correspond to representative LTP recordings of each condition.