
Fig. 1.
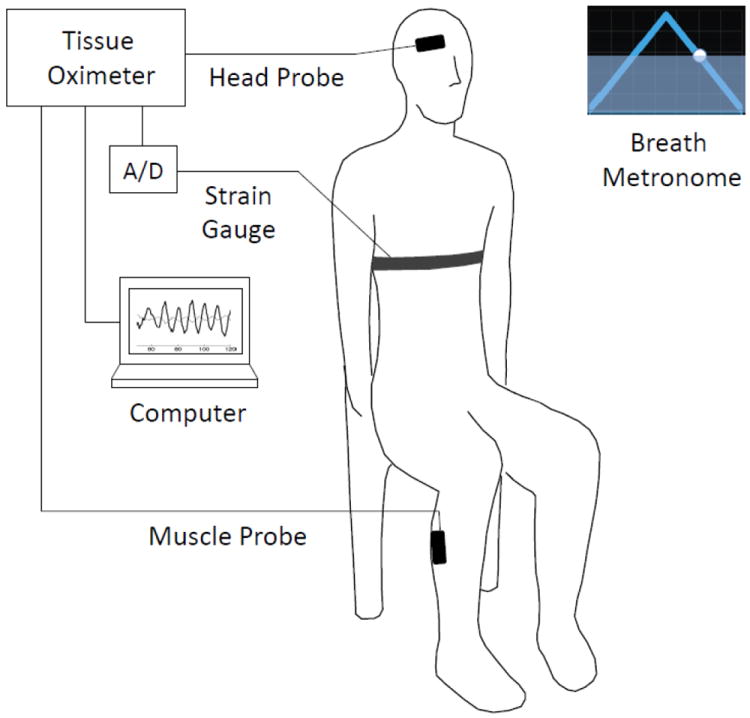
Schematic diagram of the experimental setup and protocol. Subjects were seated and performed paced breathing at specific frequencies within the range 0.07-0.25 Hz following the visual cue of a breath metronome (“Paced Breathing” Android™ application). Respiratory effort was monitored with a commercial strain gauge (Ambu Sleepmate Piezo Effort Sensor), digitized with an analog-to-digital converter (A/D), and displayed in real-time on a computer screen. Optical data were collected with optical probes placed on the right side of the subjects’ forehead (head probe) and right calf muscle (muscle probe). The optical probes were connected to a commercial tissue oximeter (OxiplexTS, ISS, Inc., Champaign, Illinois).