
Fig. 7.
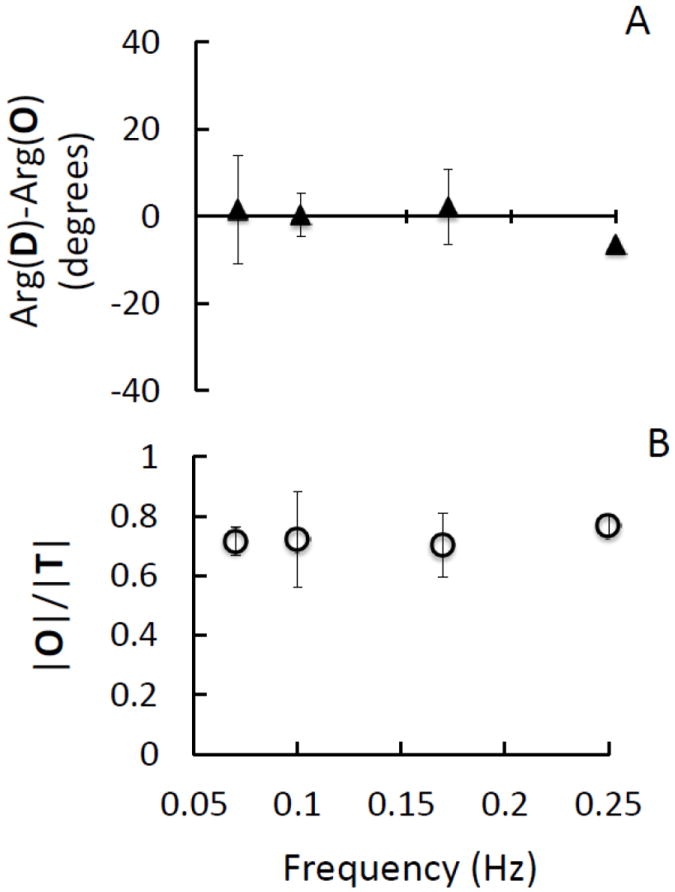
Calf muscle measurements at four paced-breathing frequencies (0.071, 0.100, 0.167 and 0.250 Hz). CHS spectra representing the average (symbols) and standard deviation (error bars) of the spectra measured on the calf muscle of four subjects (Nos. 1, 2, 3, 6). (A) Phase difference spectra of Arg(D)-Arg(O); (B) Amplitude ratio spectra of |O|/|T|.