
Figure 8.
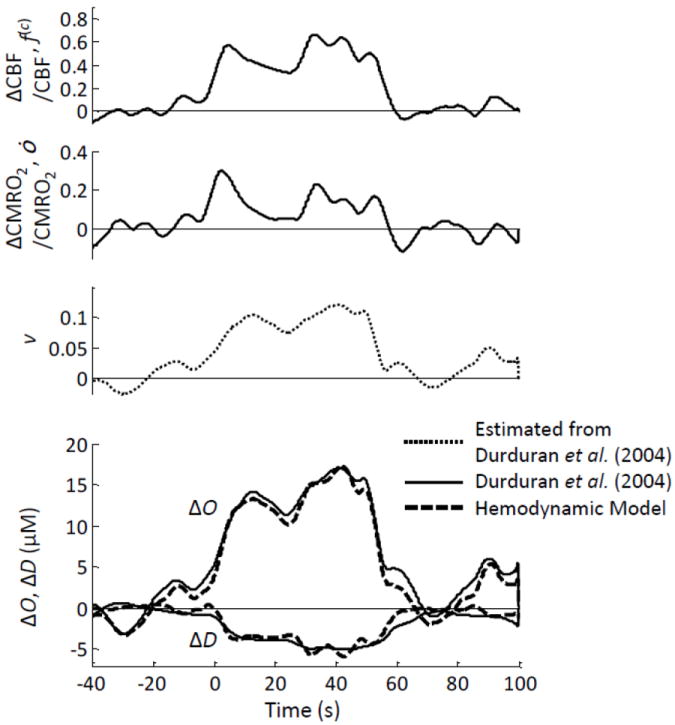
fNIRS study on human subjects during sensorimotor stimulation. The top three panels are the relative changes in cerebral blood flow (ΔCBF/CBF, f(c)), metabolic rate of oxygen (ΔCMRO2/CMRO2, ȯ), and blood volume (v) derived from the data reported by (Durduran et al., 2004) as described in the text. The bottom panel shows the oxy-hemoglobin and deoxy-hemoglobin concentration changes (ΔO and ΔD) measured by (Durduran et al., 2004) using fNIRS (solid line), and those predicted by the hemodynamic model (dashed lines).