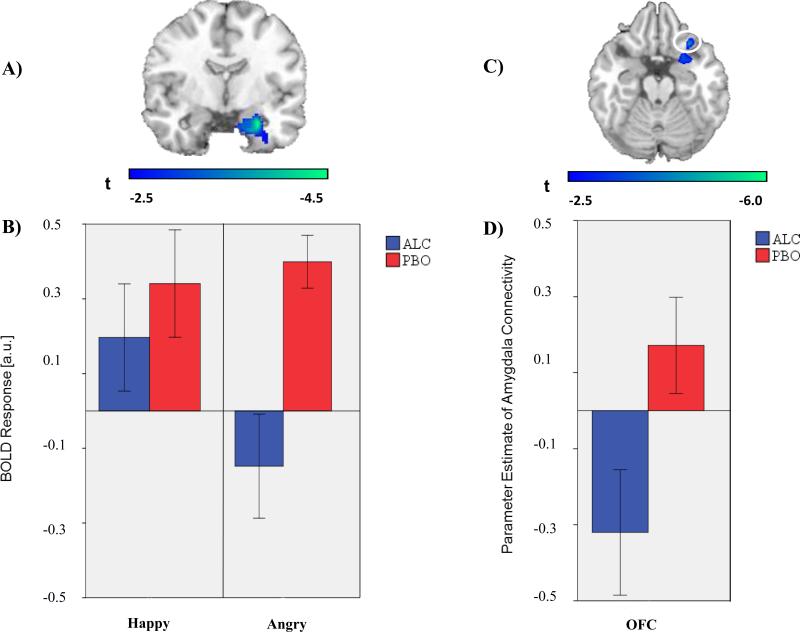
Fig. 1.
(A) Voxel-wise statistical t-map displayed on a canonical brain; Activation difference shown in relation to the amygdala anatomically derived region of interest (ROI); Color scale reflects t-score. (B) Bar graphs illustrating extracted BOLD responses from the anatomical right amygdala ROI during happy faces (> shapes) and angry faces (> shapes) for the alcohol and placebo conditions; ALC = alcohol condition; PBO = placebo condition (C) Voxel-wise statistical t-map displayed on a canonical brain; Color scale reflects t-score. (D) Bar graph illustrating extracted parameter estimates of right amygdala-right OFC connectivity during angry > shapes for the alcohol and placebo condition.

