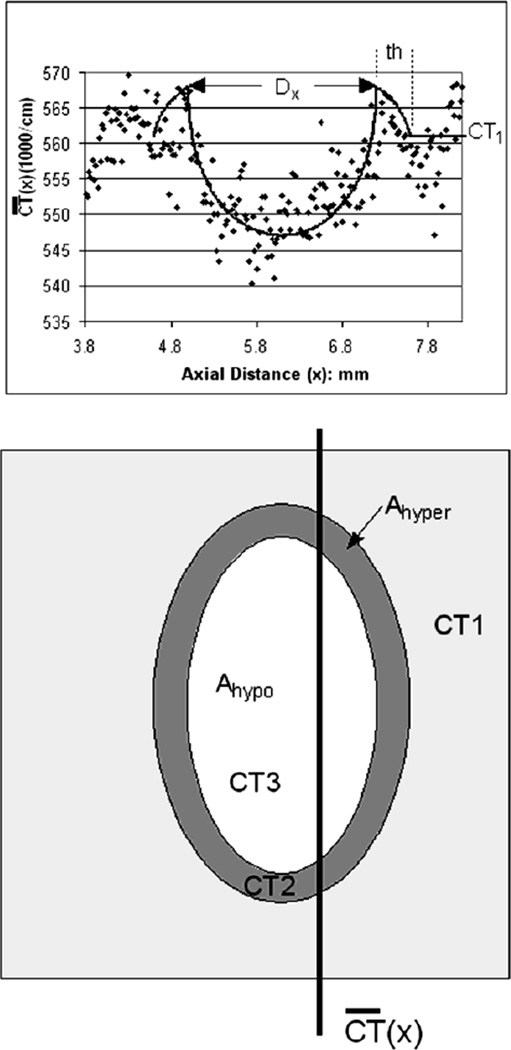
Fig. 4.
Upper panel - The quantitative image measurements of averaged contrast concentration at sequential locations along the arterial wall were ( at distance×along the arterial segment) generated from the cryo-µCT image data using the ROI illustrated in Figure 1. The contrast profile data (dots) fitted with the model described in the Appendix. The fitted contrast profile was analyzed with the minimum of the opacity ‘dip’ at axial distance 6.0mm where “x” was set to 0.
Lower panel – shows the parameters used in our model. CT1 is the CT # of the normally perfused wall, CT2 is the CT # of the hyperemic rim around the hypoperfused area. CT3 is the CT value within the hypoperfused area. Ahypo is the area of the hypoperfused region. Ahyper is the area of the hyperperfused annulus. 0.533/cm is the CT value of myocardium if no contrast agent was injected. (See Appendix for more details)

