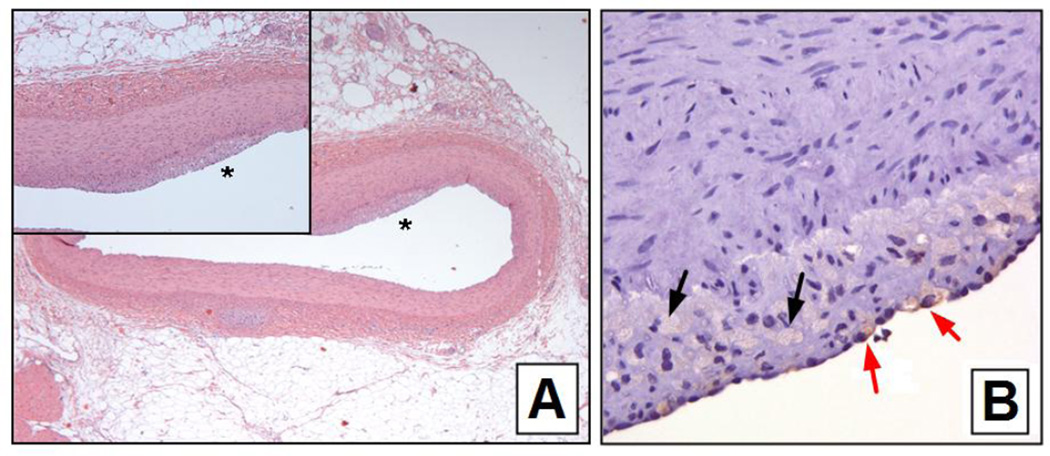
Fig. 5.
Panel A – H and E stained histological section of the LAD coronary artery of a hypercholesterolemic pig. The noise is a magnified view of the region indicated by the *. Note the subinternal thickening.
Panel B - CD68 staining of the plaque shown in A. The black arrows indicate free fat in vacuoles and the red arrows indicate fat-containing macrophages

