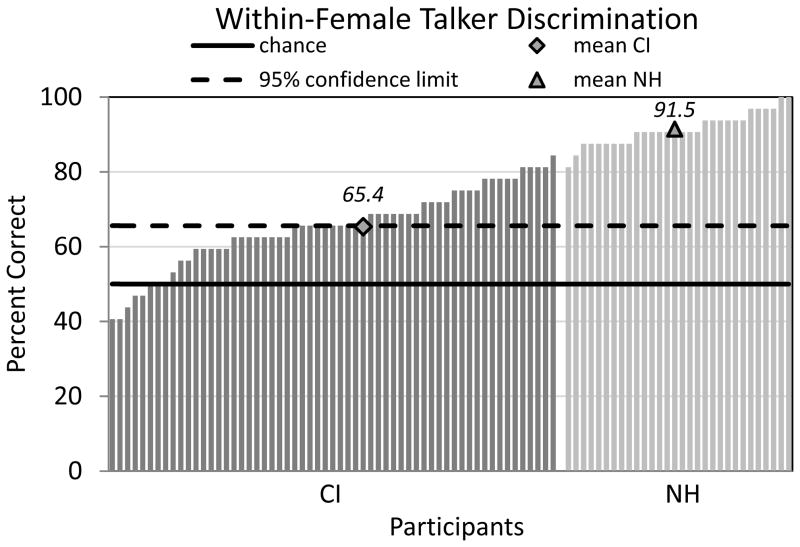
Figure 5.
Columns represent individual percent correct scores for 89 of 90 children (59 with cochlear implants and 30 normal hearing) on a same/different Within-Gender talker discrimination task (Female vs Female). One subject was not administered this subtest due to examiner error. Horizontal lines represent chance performance (solid at 50%) and the 95% confidence limit (dashed at 66%). Data for one child with CIs was unavailable for this task alone.

