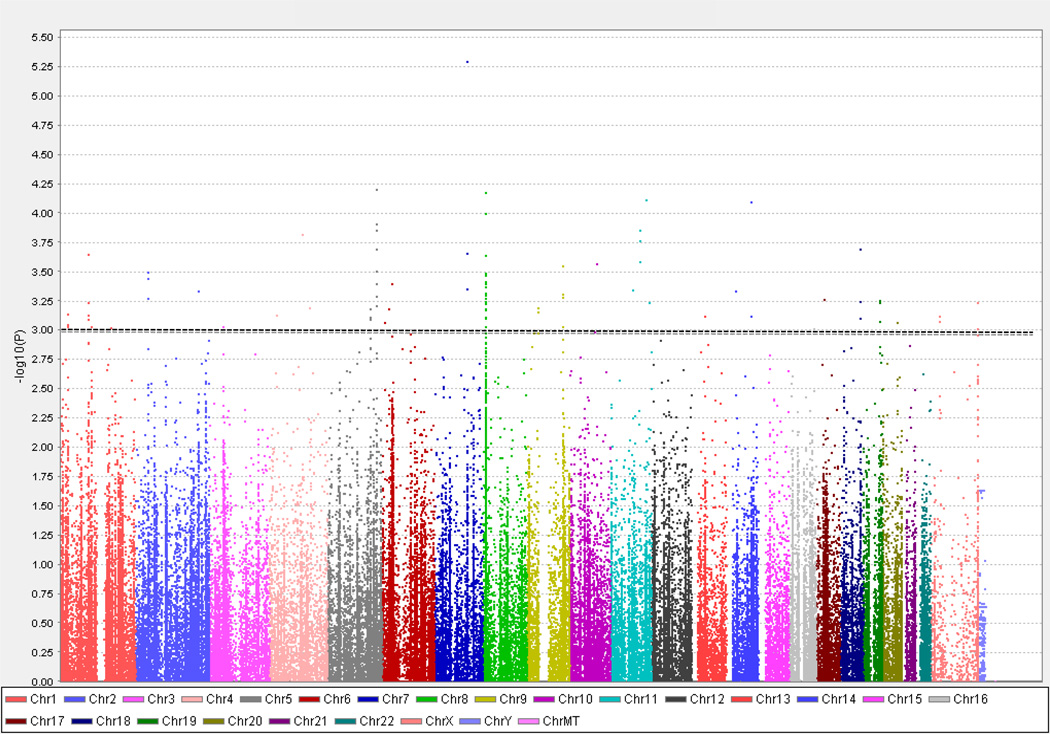
Figure 3.
Manhattan plot of immunochip association analysis data comparing all IIT cases (n = 53) to HCV controls (n = 190). 182,832 SNPs that passed the quality control testing are sorted by chromosomal location [x- axis] and are plotted against the −log10(p value) [y-axis], with the height of each point corresponding to the strength of association with disease. The dotted line indicates a p-value < 1 × 10⁻³ (the threshold we chose as our cutoff; see text) and the SNPs that show association with IIT with p < 1 × 10⁻³ are displayed above this line.

