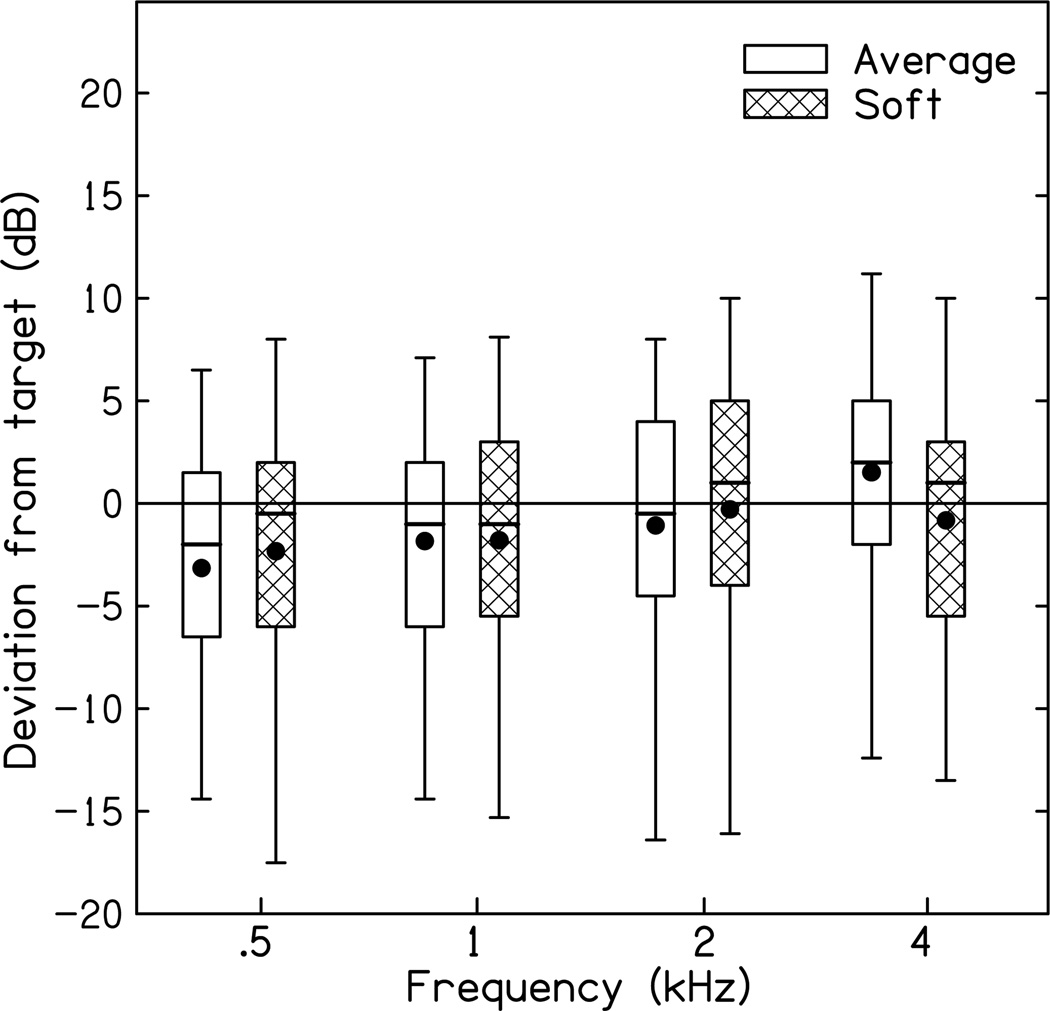
Figure 2.
Average of both ears for deviations from prescriptive target as a function of frequency. Box plots represent median (solid middle line) and interquartile range (25th and 75th percentile). Error bars represent the 5th and 95th percentile for each site. Open boxes are for average speech level inputs (65 dB SPL) and hatched boxes are for soft speech level inputs (50 db SPL). Filled circles represent mean data for each condition.

