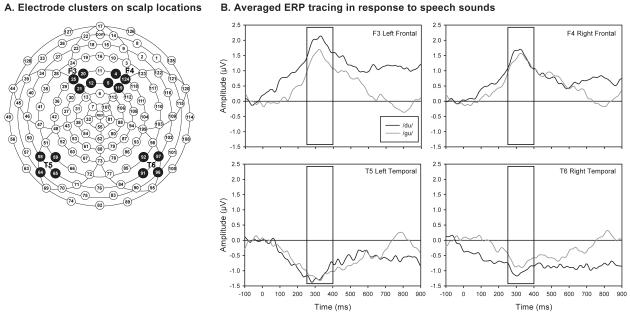
Figure 1.
Characteristics of event-related potential (ERP) methodology to measure speech-sound differentiation. (a) Electrode clusters on scalp locations: F3, frontal left; F4, frontal right; T5, temporal left; T6, temporal right. (b) Averaged ERP tracings in response to speech sounds. Auditory stimulus presented at time 0ms. Box represents time window for calculation of mean amplitude. Tracings are averaged over all 57 infants in the study.

