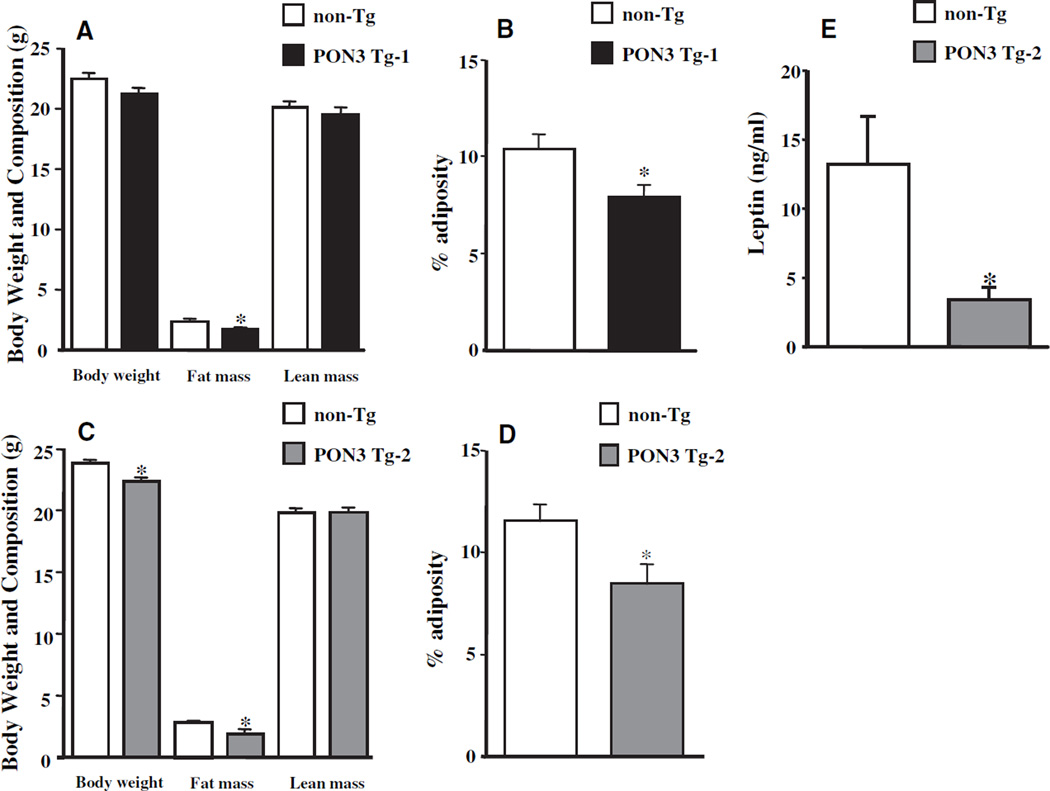
Figure 2.
Body weight and composition of male PON3 Tg and non-Tg mice on B6 background. Three-month-old male PON3 Tg and non-Tg littermates maintained on a low-fat chow diet were fasted for 16 hours before body weight, fat mass, and lean mass were measured. A, PON3 Tg-1 vs non-Tg. C, PON3 Tg-2 vs non-Tg. The adiposity was calculated as (fat mass/body weight)×100%. B, PON3 Tg-1 vs non-Tg. D, PON3 Tg-2 vs non-Tg. E, Plasma leptin levels of male PON3 Tg-2 and non-Tg littermates were determined by ELISA. The data shown are mean and SE. Sample sizes are 12 mice for each genotype group for A and B, 9 to 19 for C and D, and 5 to 7 for E. *P≤0.05 PON3 Tg vs non-Tg littermates.

