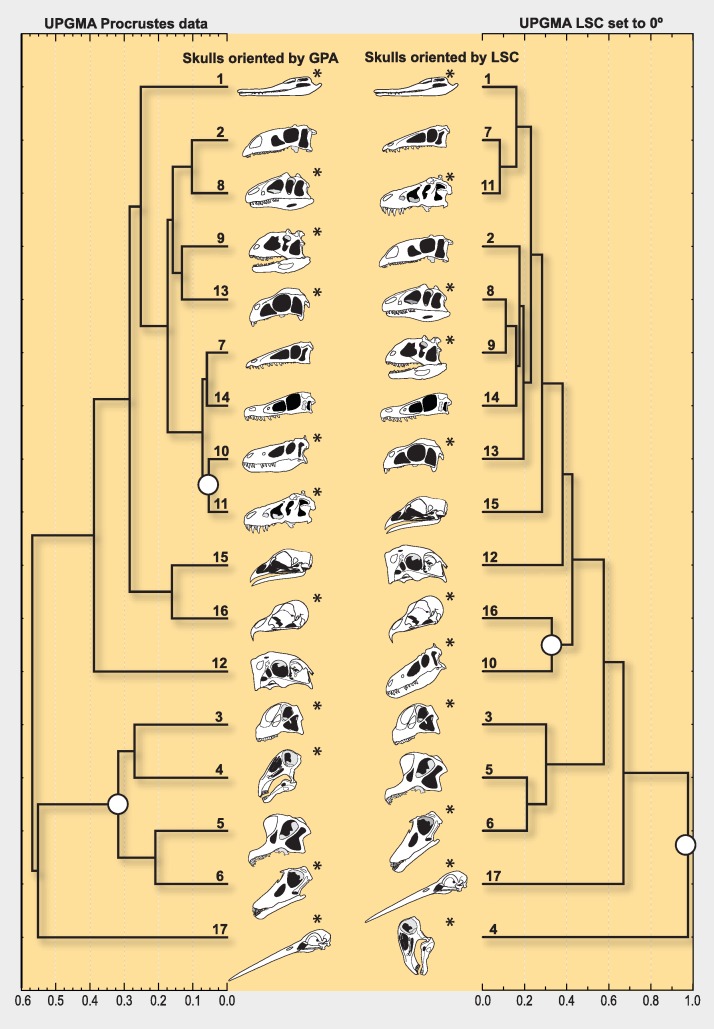
Figure 5. UPGMA phenograms grouping dinosaur skulls by geometric similarity.
Separate columns illustrate the different skull postures obtained using Procrustes methods (left column) or by aligning the LSC with the horizon (right column). The branching diagram on the right column groups skulls comparing landmark data for which only translation and scale were filtered out, but not rotation (i.e., this data includes skull posture as morphological information, determined by the LSC set to 0°). The large white dots at the nodes are highlighting cases of notable grouping differences, such as considering the skull geometry of Nigersaurus as that of either a sauropod (left) or a bizarre dinosaur (right), and that of Nanotyrannus (presumably a juvenile T. rex) as different from that of Tyrannosaurus. The grouping in the right column indicates that rotation is a main source of morphological difference among skull geometries. The numbered terminal branches denote the taxa listed in Table 1; the LSC orientation is known for those with an asterisk.

