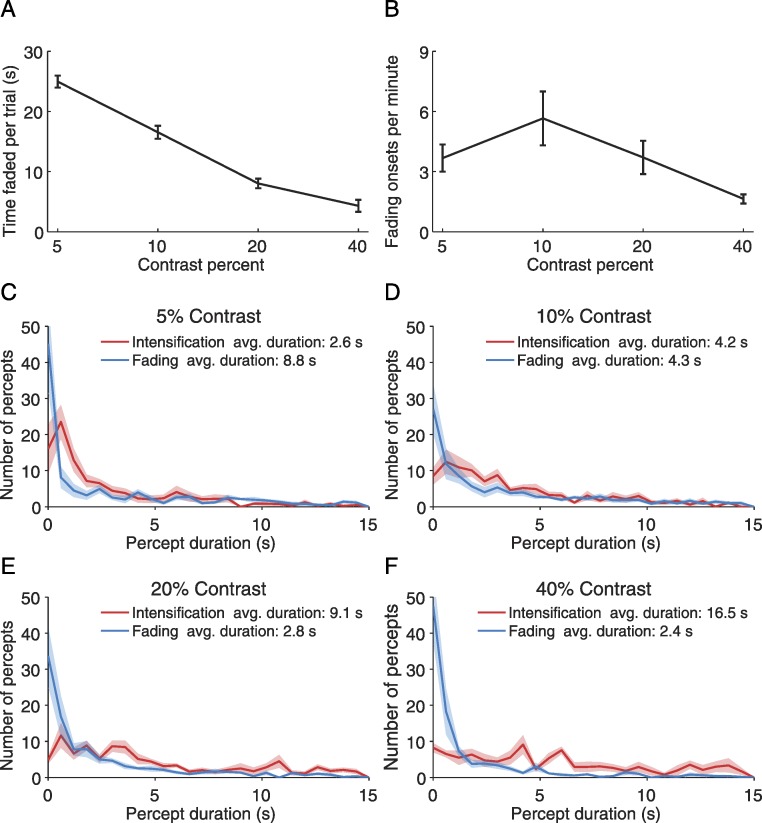
Figure 2. Perceptual reports.
(A) Average time faded per trial for each target contrast. The time faded per trial decreased linearly with target contrast (F(3, 21) = 88.48, p < 0.001; linear trend F(1, 7) = 112.36, p < 0.0001). (B) Fading onset rate for each target contrast. The effect of contrast was significant (F(3, 21) = 8.58, p = 0.0065). A Tukey HSD posthoc comparison showed a significant difference only between the 10% and 40% contrast target (p < 0.01). (C)–(F) Distribution of the durations of intensification and fading periods for each target contrast. Error bars and red and blue shadows indicate the SEM across subjects (n = 8).

