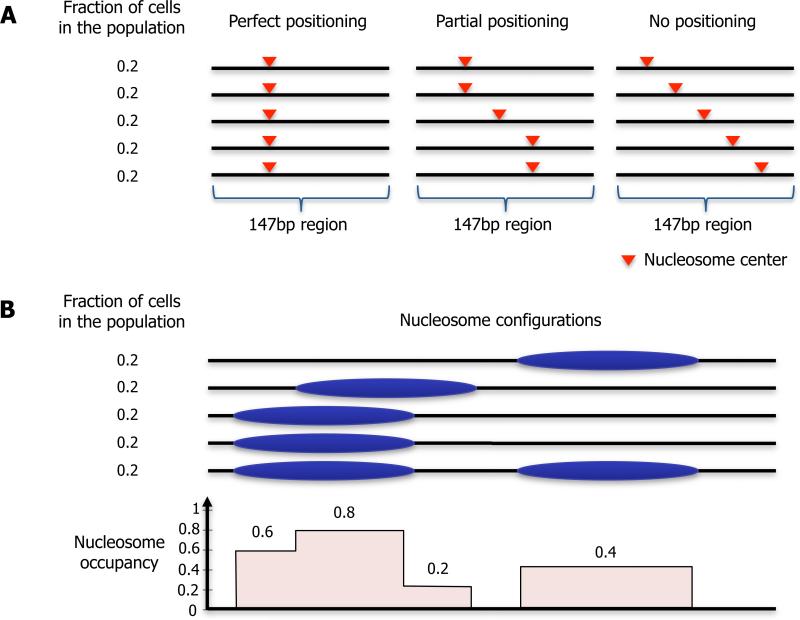
Figure 1. Illustration of the concepts of nucleosome positioning and nucleosome occupancy.
(A) Nucleosome positioning along every basepair in the genome is defined as the fraction of cells from the population in which that basepair is at the center of a 147bp nucleosome. Shown are illustrations of a 147bp region with perfect positioning (left), in which the nucleosome center is located at the same basepair across all cells; a 147bp region with partial positioning, in which there is a preference for some locations; and a 147bp region with no positioning, in which all locations have equal probability. (B) Nucleosome occupancy along every basepair in the genome is defined as the fraction of cells from the population in which the basepair is occupied by any histone octamer. Shown is an illustration of nucleosome locations across a cell population (top), and the resulting nucleosome occupancy per basepair (bottom).

