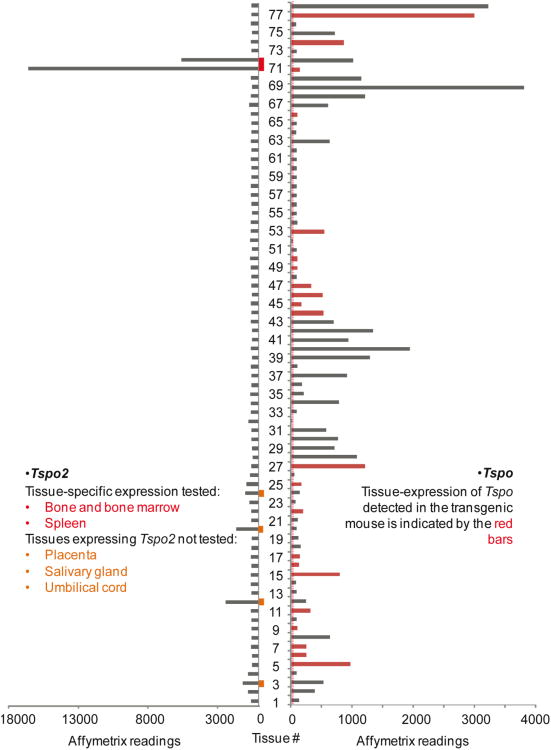
Fig. 11.
Expression profiles of Tspo and its paralogous gene Tspo2 in 78 mouse tissues/cell lines. Left panel, the gene atlas of mouse Tspo2 gene expression in 78 mouse tissues/cell lines. The large-scale analysis of the mouse transcriptome (GNF1M) has been confirmed by our previous report on the in situ hybridization of Tspo2mRNA in whole-body sections of tissues of all developmental stages (Fan et al. 2009). Right panel, the correlation between AcGFP expression driven by the 2.7-kb region of the Tspo promoter and the Tspo mRNA atlas from 78 tissues/cell lines was shown in the bar graph representing the Affymetrix GNF1M chip readings, among which the red bars indicate tissues in which Tspo-AcGFP was also found to be expressed in the current study. The background signal of Affymetrix readings can be judged from that in oocytes and fertilized eggs, indicated with the red-dotted line. The gene atlases of both Tspo and Tspo2 were retrieved from previously described raw data on the mouse protein-coding transcriptome (Su et al. 2004). The mouse tissues/cell lines are indicated as from number 1 to 78: 1, vomeralnasal organ (VNO); 2, uterus; 3, umbilical cord; 4, trigeminal; 5, trachea; 6, tongue epidermis; 7, thyroid; 8, thymus; 9, testis; 10, substantia nigra; 11, stomach; 12, spleen; 13, spinal cord upper; 14, spinal cord lower; 15, snout epidermis; 16, small intestine; 17, skeletal muscle; 18, septum (respiratory epithelium); 19, septal organ; 20, salivary gland; 21, retina; 22, prostate; 23, preoptic; 24, placenta; 25, pituitary; 26, pancreas; 27, ovary; 28, osteoclasts; 29, osteoblasts_day5; 30,osteoblasts_day21; 31, osteoblasts_day14; 32, oocyte; 33, olfactory bulb; 34, NIH 3T3; 35, neuro2a; 36, medial olfactory epithelium (MOE); 37, mast cells; 38, mammary gland lact.; 39, macrophage unstimulated; 40, macrophage_7hr LPS; 41, macrophage_1hr LPS; 42, M-1; 43, lymph node; 44, lung; 45, liver; 46, large intestine; 47, kidney; 48, hypothalamus; 49, hippocampus; 50, heart; 51, frontal cortex; 52, fertilized egg; 53, epidermis; 54, embryonic stem no feeder; 55, embryonic stem feeder layer; 56, embryo day 9.5; 57, embryo day 8.5; 58, embryo day 7.5; 59, embryo day 6.5; 60, embryo day 10.5; 61, dorsal striatum; 62, dorsal root ganglion; 63, digits; 64, cortex; 65, cerebral cortex; 66, cerebellum; 67, CD8.T cell; 68, CD4.Tcell; 69, C2C12; 70, brown fat; 71, bone marrow; 72, bone; 73, blastocysts; 74, bladder; 75, B220.B cell; 76, amygdale; 77, adrenal gland; 78, adipose tissue.

