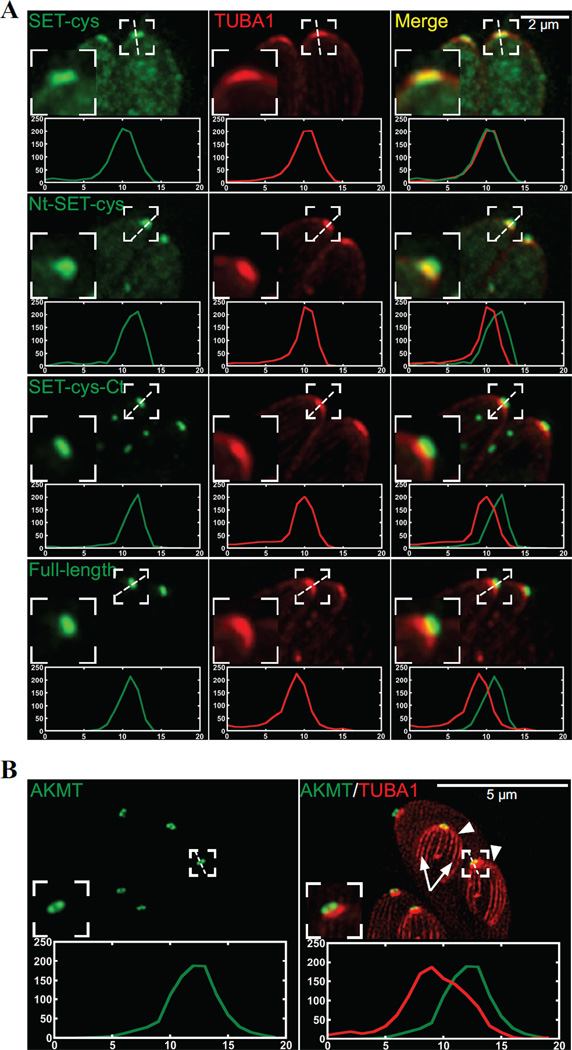
Figure 5. Colocalization of the AKMT truncations and T. gondii α1- tubulin.
A) Intracellular Δakmt parasites co-expressing mTAG-RFP-TgTUBA1 with eGFP tagged SET-cys, Nt-SET-cys, SET-cys-Ct, or full-length. To facilitate the line-scan analyses, maximum intensity projections of deconvolved 3-D stacks are used. Red: mTAG-RFP-TgTUBA1; Green: eGFP fluorescence. Insets: 2X.
B) Structured illumination-based super-resolution imaging of dividing intracellular parasites co-expressing mCherryFP-TgTUBA1 and eGFP-AKMT-full length in the Δakmt background. Arrowheads: daughters. Arrows: daughter cortical microtubules. Contrast of the mCherryFP-TgTUBA1 image is adjusted to display the daughter cortical microtubules. Insets: 2X. Line-scans represent fluorescence intensity variation along the region indicated by the white dotted lines. Green:AKMT. Red:TUBA1. X-axis: distance in pixels. Y-axis: relative intensity in arbitrary units.

