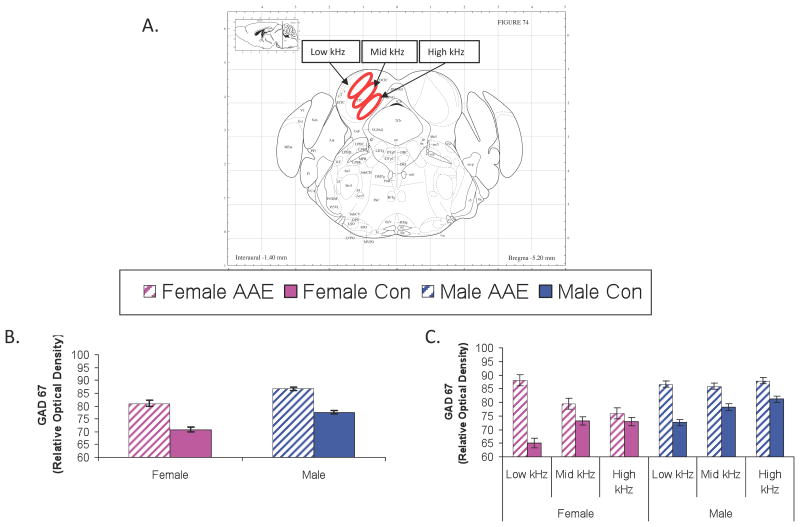
Figure 5.
GAD67 in the inferior colliclus (IC). Figure 5a depicts the approximate location of GAD67 measurements collected from the IC of aged mice using the coordinates of Paxinos and Watson. Figures 4b and 4c depict the relative optical density of GAD67 labeling in the IC in male and female mice either collapsed (5b) across tonotopic location or broken down by this feature (5c). A significant Main Effect for Treatment was found (5b) as well as a significant Sex × Treatment × Tonotopic Location (5c). Error bars = standard error of the mean.

