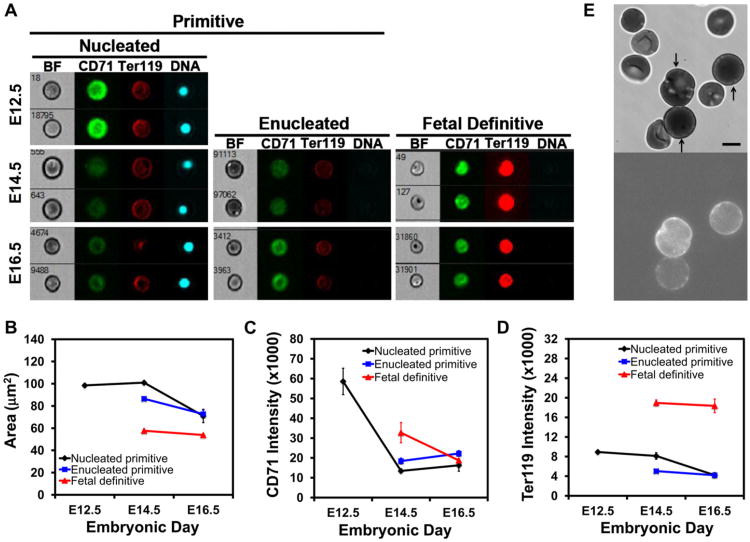
Figure 2.
Terminal maturation of primitive erythroid cells. (A) Representative images of circulating erythroid cells at E12.5, E14.5, and E16.5 of mouse gestation captured on the ImageStreamX imaging flow cytometer with a 0.75NA 40× objective lens. Cells were stained with Ter119-PECy7, CD71-FITC, and DRAQ5. (B) Changes in cell area of nucleated and enucleated primitive erythroid cells and enucleated definitive erythroid cells quantified by imaging flow cytometry. (C) Changes in surface expression of CD71 on primitive and definitive erythroid cells during their terminal maturation. The decrease inCD71 intensity on the surface of primitive erythroid cells between E12.5 and E14.5 is statistically significant (t test, p = 0.02), but the slight increase in the data between E14.5 and E16.5 is not significant (t test, p = 0.28). (D) Changes in Ter119 cell surface expression in primitive and definitive erythroid cells during their terminal maturation. Data in B, C, and D were derived from replicate measurements on three (E16.5) or four (E12.5 and E14.5) different embryos. Area represents the projected area of the cell in the image. Intensity is the median total intensity for the cells measured in arbitrary units. (E) Video-micrograph of CD9-labeled primary primitive erythroid cells. Bright-field images were obtained as for Figures 1A and 1B. Fluorescence images were obtained using the Nikon TE 2000-E microscope with a 100× 1.45 NA oil-immersion objective, and captured with a Roper Quantem 512SC digital camera using Elements software for a 900-ms exposure and multiplier of 700. Because definitive erythroid cells in the sample do not label, this methodology provided an objective method for identifying primitive erythroid cells. Scale bar = 5 μm.

