
Fig. 1.
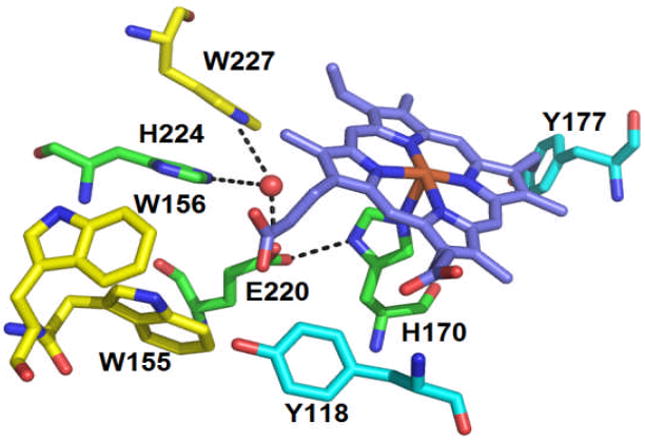
Proximal pocket of WT DaCld, with hydrogen bonding interactions indicated by dashed lines. The possible redox active residues are represented in carbon yellow (Trps) and in carbon cyan (Tyrs). The water molecule is represented as a red sphere. The figure was constructed from PDB 3Q08 using PyMOL (www.pymol.org).