
Fig. 4.
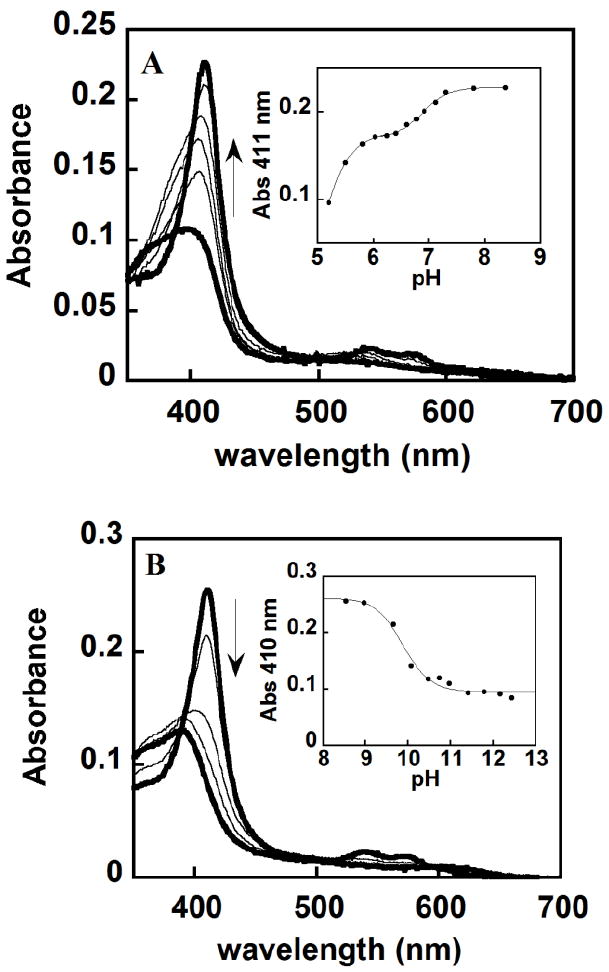
W227F pH titrations showing a reversible alkaline transition (pH 6.9) and irreversible loss of heme with midpoints at pH 5.2 and 9.9. (A) Spectra at pH 5.2, 5.5, 5.8, 6.6, 7.1 and 8.4 are shown. (B) Spectra at pH 8.9, 9.7, 10, 10.9 and 12.4 are shown. The two extreme pHs for both titration are represented with a thick black line. Insets show the fitting of two (A) or one (B) sigmoidal curve. A Hill coefficient of 1 was found for each fit, indicating no evidence of allosteric interactions among the DaCld monomers.