
Fig. 9.
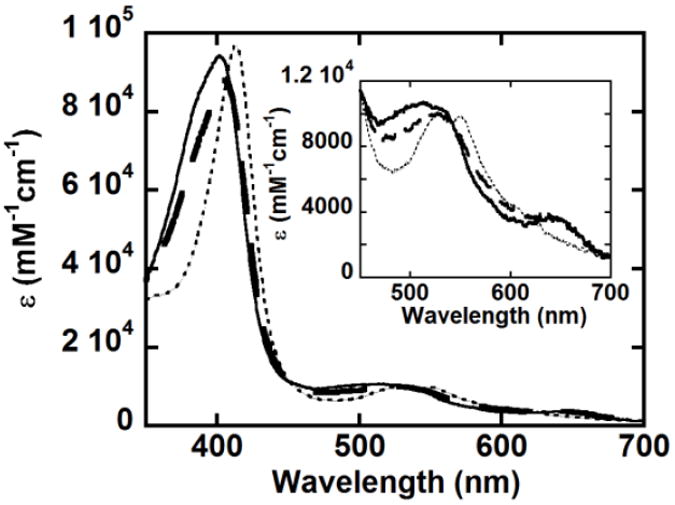
Components obtained from the global analysis of the reaction of 2 μM W227F with 50 μM PAA at pH 6 and 20 °C. A two-step A→B→C model was used to fit the data, yielding k1 = 16 s-1 and k2 = 5.4 s-1. The inset shows the visible region on an expanded scale. The ferric form is shown as a black line, intermediate B as a dashed line, and intermediate C as a dotted line.