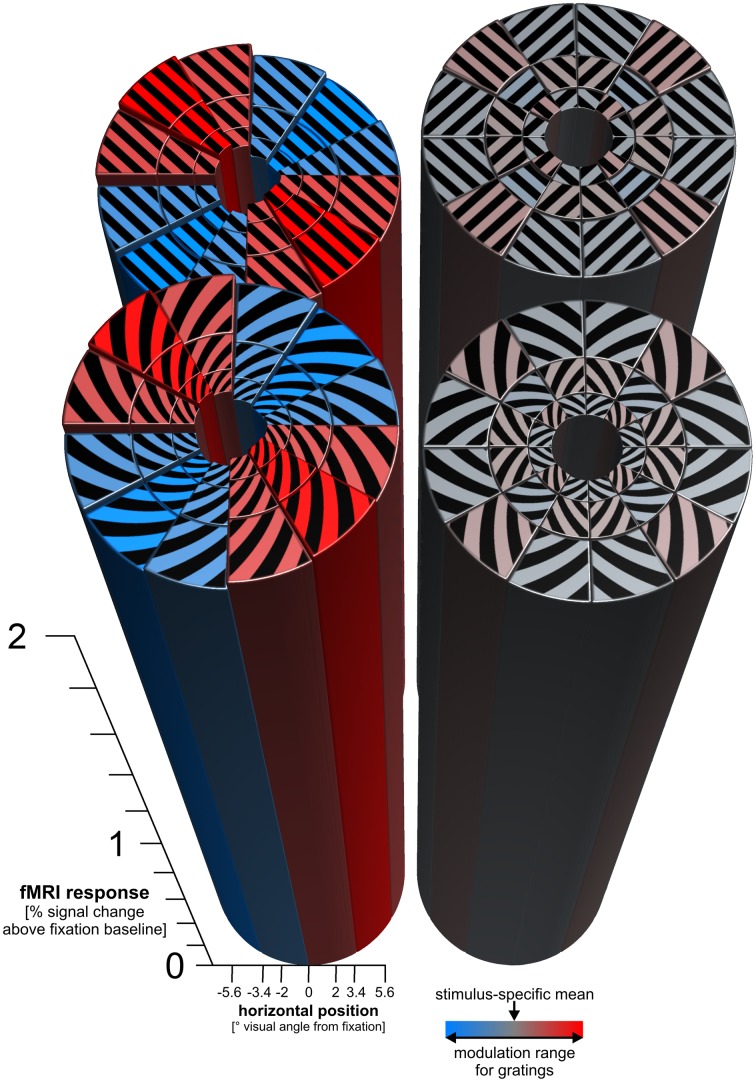
Figure 4.
Radial and vertical preference maps. The figure shows the response predictions of cosine-tuning models of radial and cardinal preference. For each log-polar patch of a stimulus, a bar shows the response of the V1 region representing that patch. Each patch responds strongly to each stimulus (overall height of the bars > 2% signal change). On top of the strong overall response, there is a subtle modulation consistent with a global radial preference for gratings (± 0.025% signal change). There is a similar subtle modulation consistent with a vertical preference map for spirals (± 0.021% signal change). For patch-swapped stimuli, these modulations were much smaller (± 0.0028% signal change for patch-swapped gratings, ± 0.0018% signal change for patch-swapped spirals). These effect sizes are amplitude parameter estimates of cosine-tuning models (see Methods), averaged across all 18 participants. For inference on these effects, see Figure 5.

