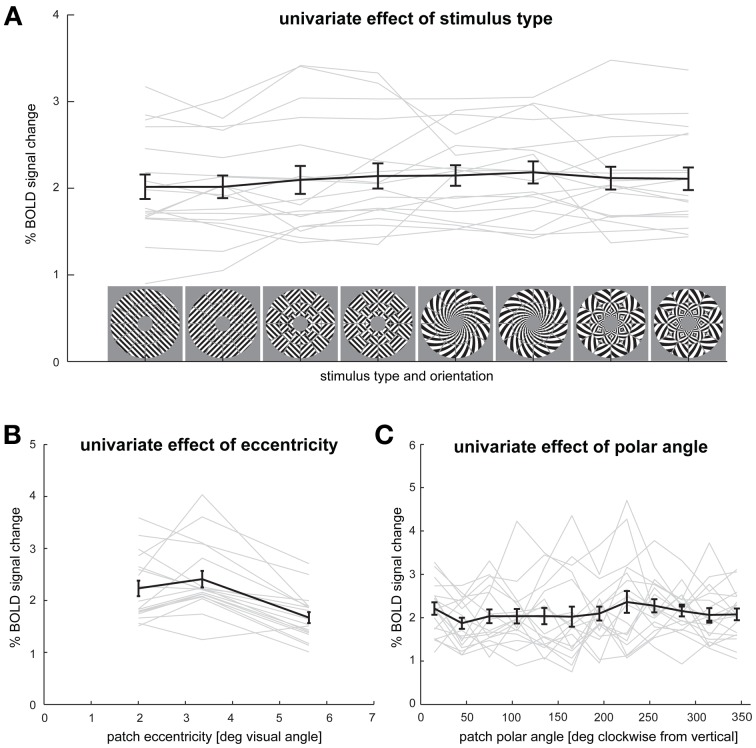
Figure 7.
Effects of stimulus type, eccentricity, and polar angle on average V1 responses. (A) Spatial-mean V1 activation for each stimulus type and orientation. (B) V1 response for each of the three patch eccentricities. (C) V1 responses for each of the 12 polar angles. Responses are averaged across the remaining variables (stimulus type, V1 patches, participants). Error bars indicate the SEM computed across participants. Gray lines depict each individual participant's responses.

