
Figure 1.
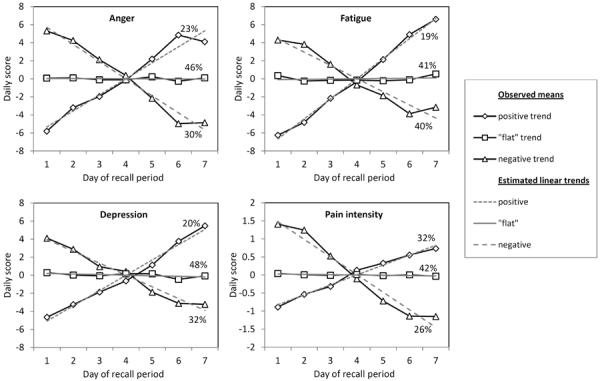
Observed means and estimated linear temporal trends for daily scores in each of the latent classes. Percentages represent the percent of weeks in each class. The estimated linear trends intersect approximately on day 4 due to the within-week centering applied to the observed daily scores.