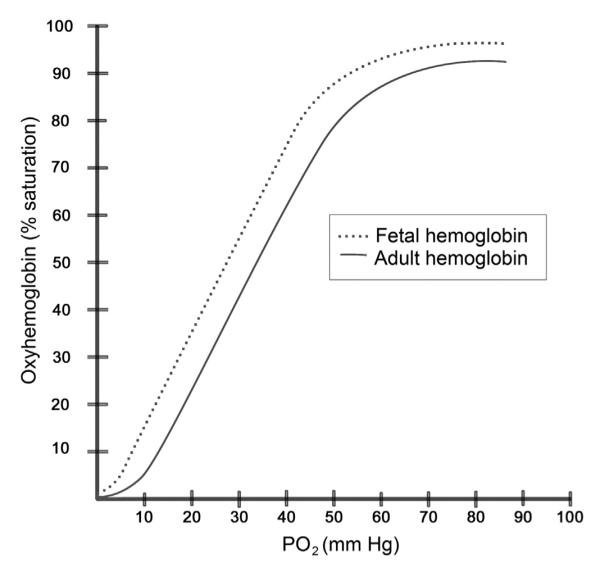
FIG 1.

Oxyhemoglobin dissociation curve: relationship between oxygen saturation and partial pressure of oxygen for fetal and adult hemoglobin curve. Decreased 2,3-DPG and increased pH can shift the curve to the left, whereas increased 2,3-DPG or decreased pH can shift the curve to the right.
