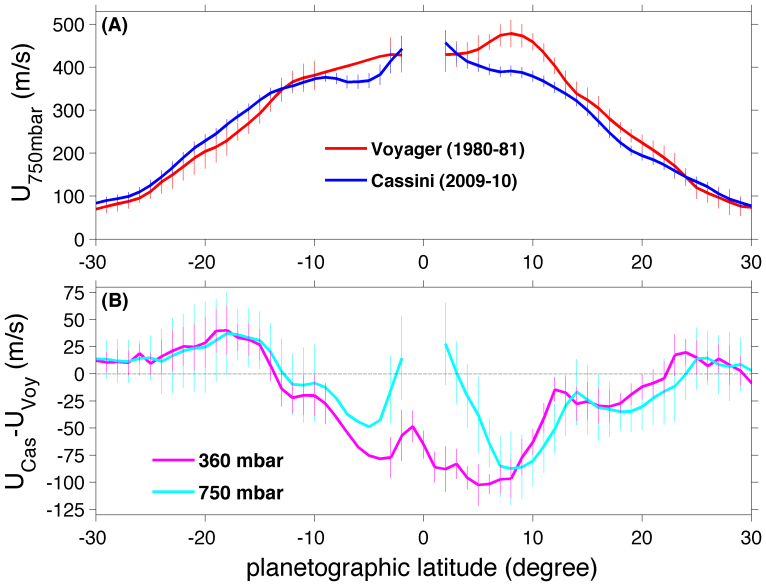
Figure 4. Comparison of zonal winds between different times and between different pressure levels.
(A) Comparison of 750-mbar zonal winds between the Voyager epoch (1980–81) and the Cassini epoch (2009–10). The 750-mbar zonal winds come from the thermal winds shown in Fig. 3. (B) Comparison of temporal variation in the zonal winds between 360 mbar and 750 mbar. The Temporal variation of zonal winds at 360 mbar and 750 mbar comes from Fig. S1 and Fig. 3, respectively. There are no Voyager observations for the latitude range of 2.0°S–10°S, which is interpolated from the neighboring measurements. Therefore, there are no error estimates for such a latitude range (2.0°S–10°S) (Section S4 in the Supplementary Information). The gaps around the equator (3°N–3°S) in the 750-mbar profiles are due to the integration routines of the modified thermal wind equation.

