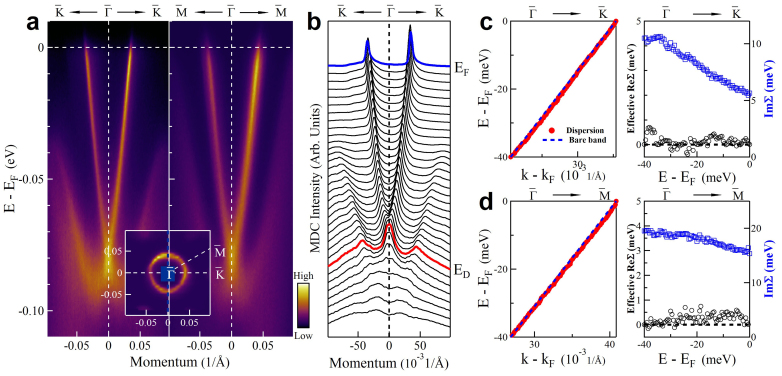
Figure 2. Extremely weak electron-phonon coupling in p-type Bi2Te3.
(a) Surface state dispersions along  (left panel) and
  (right panel) directions. The inset shows the Fermi surface of p-type Bi2Te3. (b) Momentum distribution curves (MDCs) of the surface state dispersion along
  . Red line and blue line indicate the MDCs at the Dirac point (ED) and the Fermi level (EF), respectively. (c) Dispersion and effective electron self-energy of surface state band along
  direction. The left panel shows the measured dispersion (red circles) obtained from MDC fitting. The blue dotted line represents an empirical bare band that is a straight line connecting two points in the measured dispersion, one at EF and the other at 40 meV binding energy. The right panel shows the effective real part of the electron self-energy, ReΣ(k, ω) (black circles), and imaginary part of the electron self-energy, ImΣ(k, ω) (blue squares). (d)Dispersion and effective electron self-energy of surface state band along
  direction.

