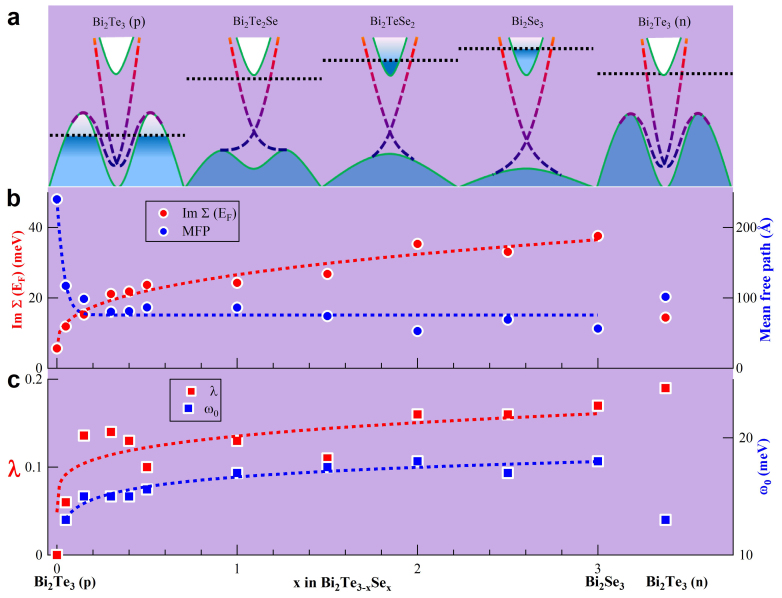
Figure 4. Variation of electron-phonon coupling and electron-disorder scattering with composition, x, in Bi2(Te3−xSex) topological insulators.
On the far right side, data on n-type Bi2Te3 are also included. (a) Schematic band structure at several typical compositions to show the relative position between the topological surface states (color dashed lines) and the bulk states (green solid lines). Black dashed lines indicate the Fermi level. (b) Variation of the electron-disorder scattering (red circles) with composition, x, in Bi2(Te3−xSex) topological insulators. It is obtained by taking the value of the imaginary part of the electron self-energy at zero energy (EF) as shown in Fig. 3c. Also shown is the electron mean free path (blue circles) calculated from the measured MDC width at the Fermi level. (c) Variation of the electron-phonon coupling strength λ (red squares) and characteristic energy scale ω0 with the composition, x, in Bi2(Te3−xSex) topological insulators and in n-type Bi2Te3. The dashed lines in (b) and (c) are guide to the eyes.

