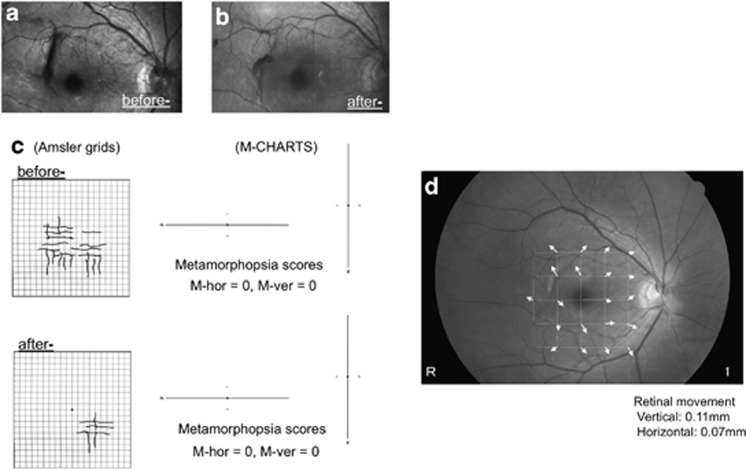
Figure 4.
SLO images obtained with an argon blue laser beam and results of Amsler charts and M-CHARTS in patient no. 5. (a) Before- and (b) after- SLO images. (c) The results of Amsler charts and M-CHARTS evaluations of metamorphopsia at before and after spontaneous separation of ERM. (d) The fundus image with vector arrows, which was analyzed by our developing software, shows the direction and distance of retinal vessel movements.

