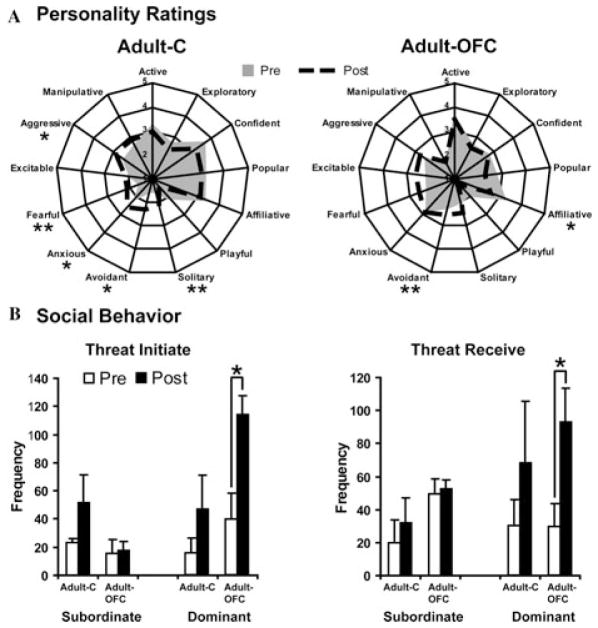
Figure 2.
Effects of OFC lesions on social interactions for adult animals with OFC lesions (Adult-OFC) and sham-operated controls (Adult-C). In A, personality attributes are listed along the outside of the radial plots, with the shaded area representing mean scores collected before surgery (pre) and the dashed lines representing scores measured after surgery (post). All ratings were on a five-point scale, ranging from not at all descriptive (score = 1) to very descriptive (score = 5). In B, frequency of “threat initiated” and “threat received” pre- and postsurgery (white bars and black bars, respectively) are given separately for subordinate and dominant animals of each group. *P < 0.05 and * *P < 0.01 for differences between pre- and postsurgery assessments.

