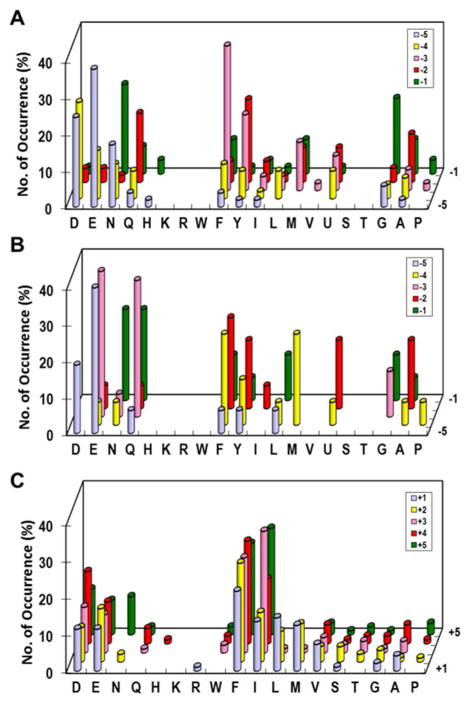
Figure 2.
Sequence specificity of VH1 toward pS/pT peptides. (A) Preferred class I substrates selected from the N-terminal library (X5pS/pT). (B) Preferred class II substrates selected from the N-terminal library. (C) Preferred substrates selected from the C-terminal library (pS/pTX5). The histograms represent the amino acids identified at each position from P−5 to P+5 (z-axis). Frequency of occurrence on the y-axis represents the percentage of selected sequences that contained a particular amino acid at a certain position. M, Nle; U, Abu.

