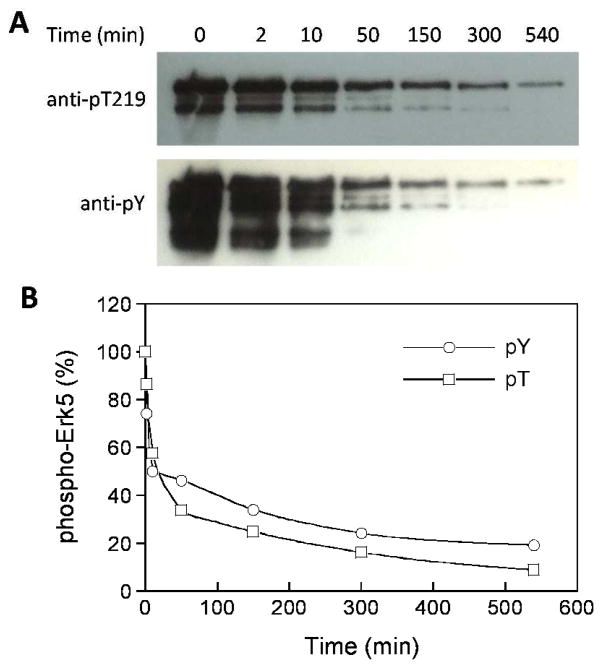
Figure 4.
In vitro dephosphorylation of Erk5 (19 μM) by VH1 (1.5 μM). (A) Western blots showing the remaining pT219 and pY levels after different reaction times (0–540 min). (B) Reaction progress curves for VH1-mediated Erk5 dephosphorylation at pT and pY sites. The y axis values were derived from part A by phosphoimaging analysis and relative to that at reaction time 0 (100%).

